Beginners tutorial to introduce straditize
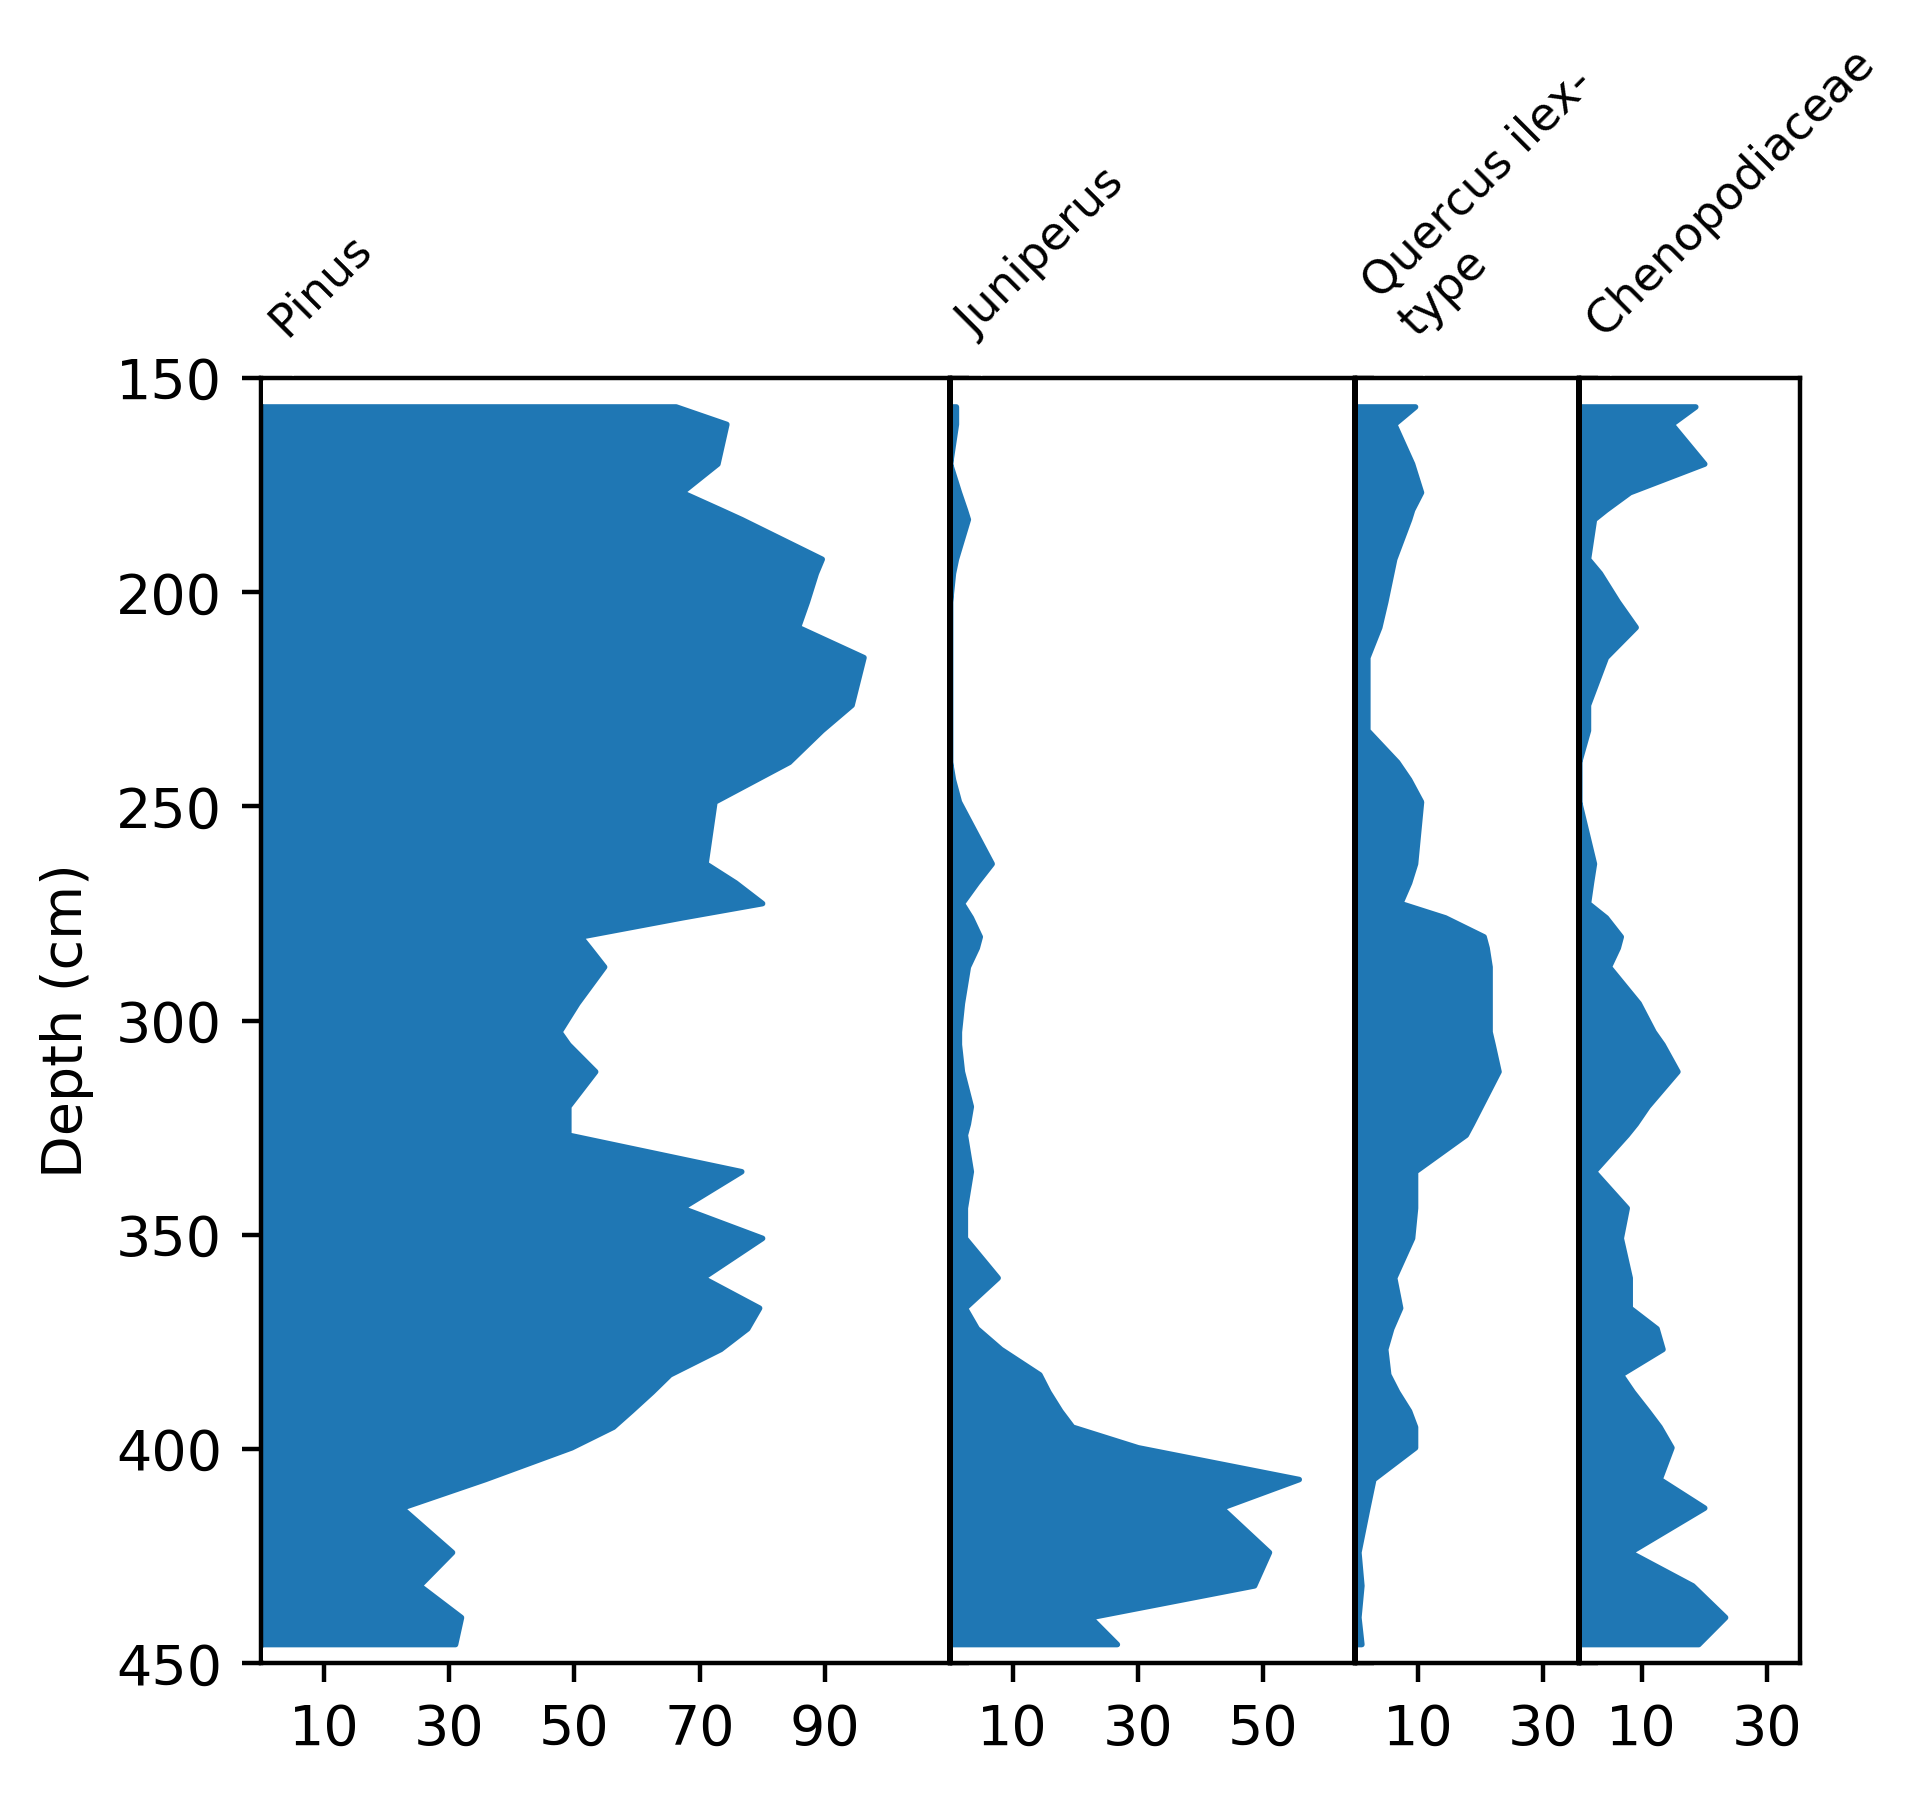
In this tutorial, we digitize a simple small pollen diagram a subset of the Hoya del Castillo dataset from [Basil2007a]. This tutorial will introduce you into the main parts of straditize and the basic workflow.
At the bottom of the straditizer control, you find a navigation panel which helps you to navigate through the tutorial. Click the Next button in this control to start the tutorial. You can skip steps by clicking the Skip button and you can check what you have done using the Check button and then proceed with the next step.
The tutorial will take between 5 and 10 minutes. You can save your current state to a file using (see Saving and loading your project) and reload it later via
If you have questions or troubles with this tutorial, please open an issue on
https://github.com/Chilipp/straditize/issues
and we will do our best to assist you.
- 1. The straditize workflow
- 2. Load the image of the diagram
- 3. Navigation inside the plot
- 4. Select the diagram part
- 5. Create the diagram reader
- 6. Selecting the columns
- 7. Cleaning the image
- 8. Digitizing the data
- 9. Finding and editing samples
- 10. Translating the y-axis
- 11. Translating the x-axis
- 12. Column names
- 13. Done!
References
- Basil2007a
Davis, Basil A. S., and A. C. Stevenson. “The 8.2ka Event and Early-Mid Holocene Forests, Fires and Flooding in the Central Ebro Desert, NE Spain.” Quat. Sci. Rev. , vol. 26, no. 13-14, 2007, pp. 1695-712, doi:10.1016/j.quascirev.2007.04.007.