10. Digitizing the diagram
The digitization transforms your picture into a table. The outcome is a data frame with one value for each row and column in the data part of your image. After the digitization, you can access this raw data from the command line via:
stradi.data_reader.full_df
and you can plot it using the Full digitized data item in the plot control.

The digitization procedure depends on the reader type that you are using (see Selecting the reader).
Contents
Digitizing area and line readers

This class of stratigraphic diagrams is the most popular within the pollen diagrams and it’s digitization is fully automatic.
The algorithm simply uses the distance of the most right data (black) pixel to the column start.
Digitizing bars
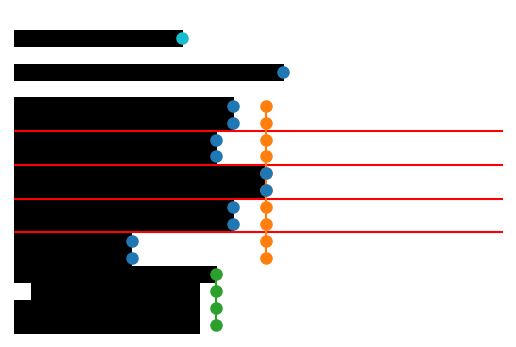
For digitizing bar diagrams, it is crucial that the software finds and distinguishes adjacent bars. This is mainly done through the tolerance. The algorithm is: if the pixel row, compared to the previous row, is higher or smaller by the given tolerance , the software assumes that those two rows belong to two distinct bars.
The image above illustrates this. The reader distinguishes the bars that are clearly separated or were one bar is significantly lower or higher than the other, but it cannot distinguish bars were there is only a small difference in height.
Splitting bars
|
→ |
|

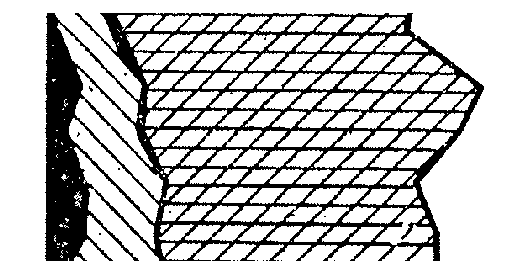
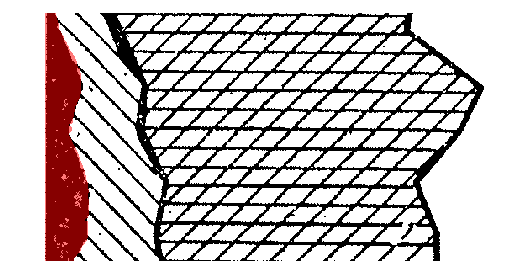
To overcome this problem, straditize automatically finds the bars that are wider than the others and marks them for splitting. If the straditizer finds bars that are too long, they are shown in the Split too long bars tab of the digitization control. To split one bar:
Double-click an item in the table (the plot will zoom to the bar)
Left-click on the bar to indicate the vertical location for a split (right-click again on the same line to revert this). A red line will appear (left-click, see image above) or disappear (right-click)
Click the
 symbol to continue with the next bar that is too long
or double-click an item in the table. Again split the bar as described in 2.
symbol to continue with the next bar that is too long
or double-click an item in the table. Again split the bar as described in 2.When you are done, hit the Apply button and the bars will be splitted right were you marked it
Digitizing stacked areas
initial |
column 1 |
||
|
→ |
|
|
column 2 |
column 3 |
||
→ |
|
→ |
|
column 4 |
column 5 |
||
→ |
|
→ |
|
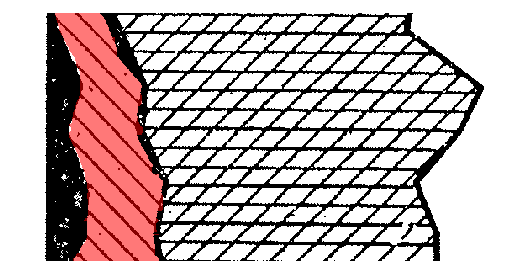
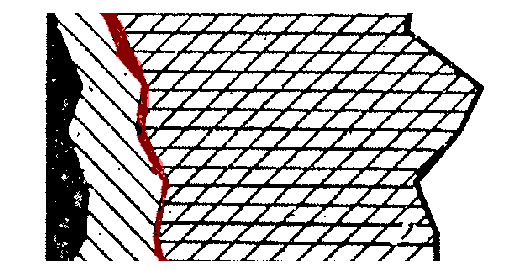
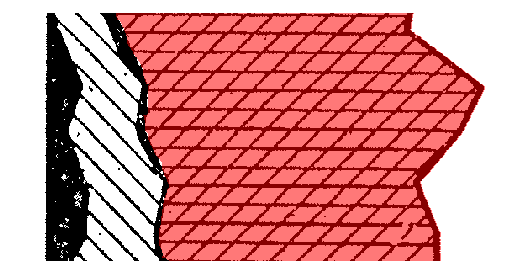
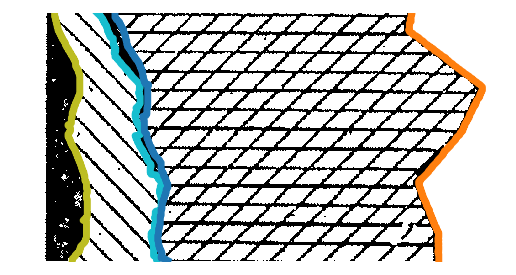
Stacked diagrams are more difficult to digitize because of the variety of combinations. The columns might be distinguished by colors or patterns (hatches). Therefore, the user has to select the features corresponding to one column, one after the other.
The digitization here works as follows:
click the Digitize button, you will see a control for navigating within the columns
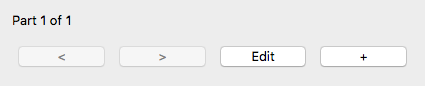
click the + button to setup a new column. Everything in the column will be selected and now you have to select only those features, that are part of the first column using the selection tools (see the column 1 above).
When you did this, click the Apply button.
click the Edit button if you want to edit the column that you just selected
Click the > button to go to the right column
click the + to add a new column and select the second column (see above)
repeat the steps 3-6 until you digitized all columns
If you want to display your digitization result, use the Full digitized data in the plot control.
Hint
you can change the transparency of the selection with the transparency slider in the selection toolbar. That helps to still see the selected features