4. Select the starts for each column
A stratigraphic diagram is defined through different columns, each column represents one variable (or for pollen diagrams, one taxa, species, PFT, etc.). To digitize the data, we have to know, where each of these column starts exactly.
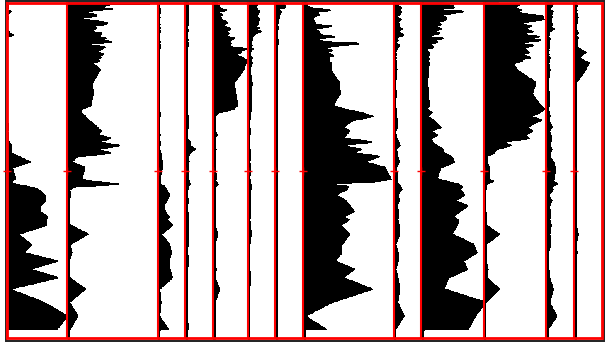
After having clicked the Column starts button, the software automatically estimates the starts of the columns. However, you should check whether they are all recognized correctly.
There are several possibilities to edit the automatically estimated columns:
Hold the Shift button and left-click on the plot to create a new vertical mark.
Then Left-click the mark and drag it to the start of one column.
Delete a column start by right-clicking the mark.
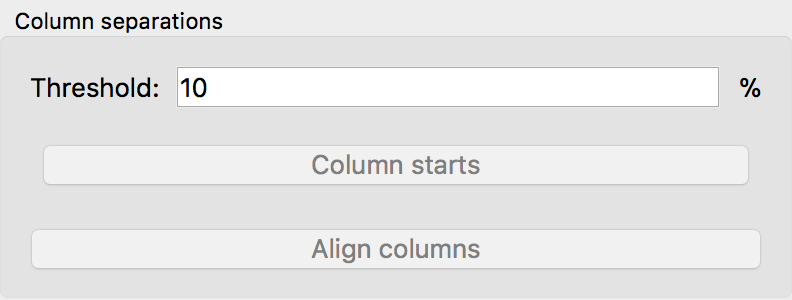
Modify the threshold. It defines the percentage of a pixel column that has to be covered to assume a valid column start. If you have columns that only contain a very small amount of data, you should lower it