Basics and Terminology
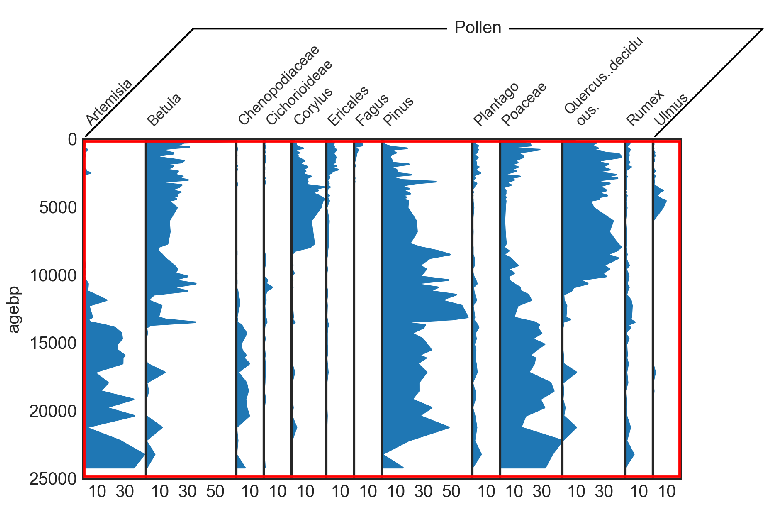
A stratigraphic diagram consists of multiple diagrams that are vertically or horizontally aligned, i.e. that have either the same x- or y-axis.
This software assumes, that all the subdiagrams share the y-axis, i.e. the vertical axis. If this is not the case for your specific diagram, just rotate your image by 90°.
- column
One column in the diagram means one of the subdiagrams (e.g. Betula in the example diagram above). The total number of columns is the number of subdiagrams in your plot.
- pixel column
One pixel column is the horizontal pixel index (x-axis), ranging from 0 to the width of your image. Pixel column 0 represents all pixels on the very left side.
- row or pixel row
One pixel row (or sometimes only row) is the vertical pixel index (y-axis), ranging from 0 to the height of your image. Row 0 represents all pixels at the top.
- diagram part
This is the part where the data is shown (red rectangle in the figure above).
- binary image
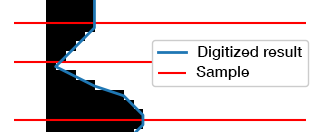
The binary image is the diagram part converted to black (1) and white (0). Every black pixel in this binary image represents data that should be digitized.
- digitize
Digitization means transforming each pixel into a value (see the blue line in the image above). Therefore, in contrast to the samples, you get one data value for each pixel row in the binary image. We also refer to this as the full data.
- sample
The samples (red lines in the image above) are a subset of the digitization result. In a very basic sense, the samples represent the original data that was used to create the diagram. In a sediment core for a pollen diagram, it would be one slice of the core that was analyzed under the microscope.
- straditizer
Everything that refers to the straditizer refers to the full image of your stratigraphic diagram. Speaking in a programmatically sense, it is the top-level interface to digitize the diagram, an instance of the
straditize.straditizer.Straditizerclass. You can always access the current straditizer through thestradivariable in the ipython console of the GUI- reader or data reader
This is the object that digitizes the diagram part (red area above). For different diagram types (area plot, bar plot, etc.) you have different readers with different functionalities.
The reader of your diagram can be accessed via typing
stradi.data_readerin the ipython console of the GUI.