Translating the horizontal axes
For your final product, straditize needs to know about how the data in the diagram is scaled, such that we can transform the final sample information from the pixel coordinates into the units of the diagram (e.g. percent for pollen data or Kelvin for temperature, etc.).
To translate the x-axis information,
Expand the Axes translations tab in the digitization control
Click the Insert X-axis values button in the Axes translations section of the straditizer control (if not already done)
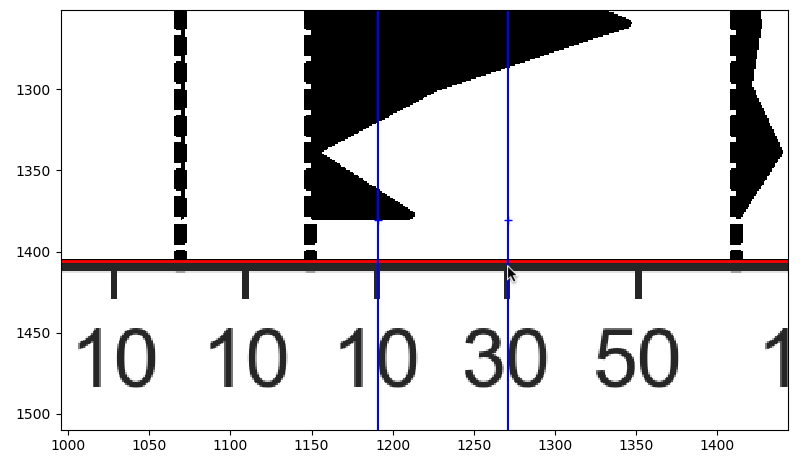
Shift-leftclick on the plot in one of the columns to enter the corresponding x-value.
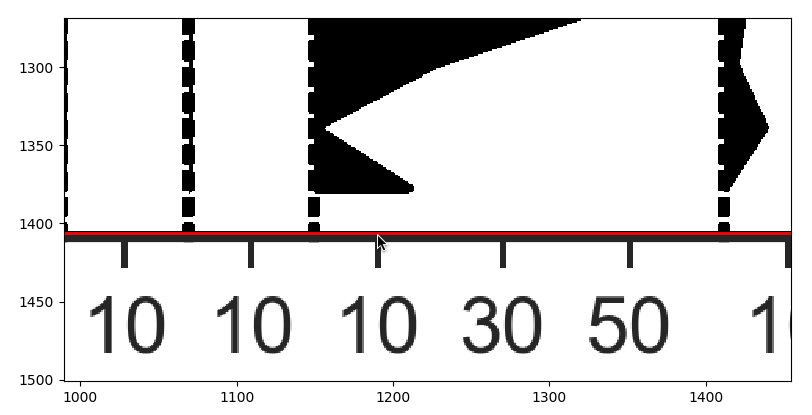
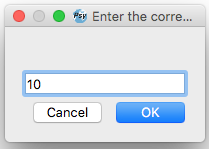
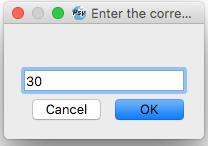
A small dialog will appear where you should enter the x-value to use (in this case,
10)
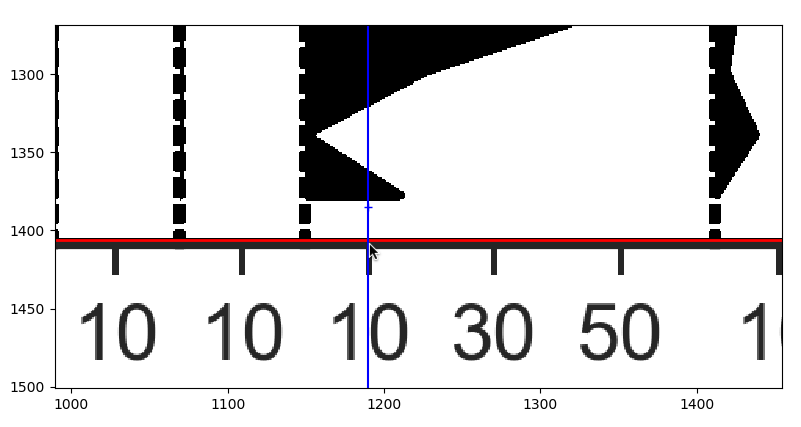
After hitting the Ok button, you will see a mark on the plot (blue line). You can select the mark via leftclick and drag it to a different location or you can delete it via rightclick.
now repeat steps 3-5 on a second point in the same column
Select another point
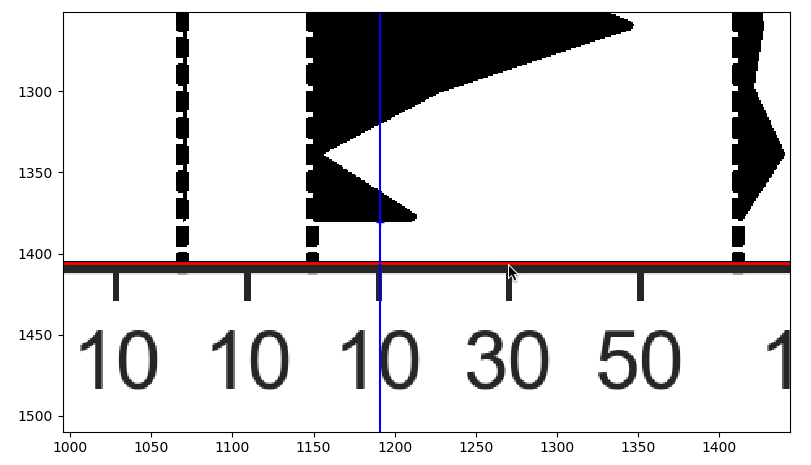
Enter the corresponding value (here
30)
A new mark is created that you can modify
7. Click the Apply button at the bottom of the straditizer control when you are done.
Note
If you have different units or different scalings in the diagram, create column specific readers and translate the x-axis separately for each reader/column.
Note
If you drag a mark and hold the Shift button while releasing the mouse button, the dialog in point 3 from above will not pop up.