1. The straditize workflow
The straditize workflow, i.e. the program for the next few minutes consists of 6 main steps:
Load the diagram
Select the diagram part (withouth x-axes labels, y-axes labels, etc.)
Clean the diagram part. Only the data parts should be left over, i.e. no y-axes, lines, letters, etc.
Digitize the diagram
Find and edit the samples
Export the data to Excel or CSV
Most of these tasks can be done in an automatic way but you should always review and edit the outcome to make sure that what you do is scientifically reliable.
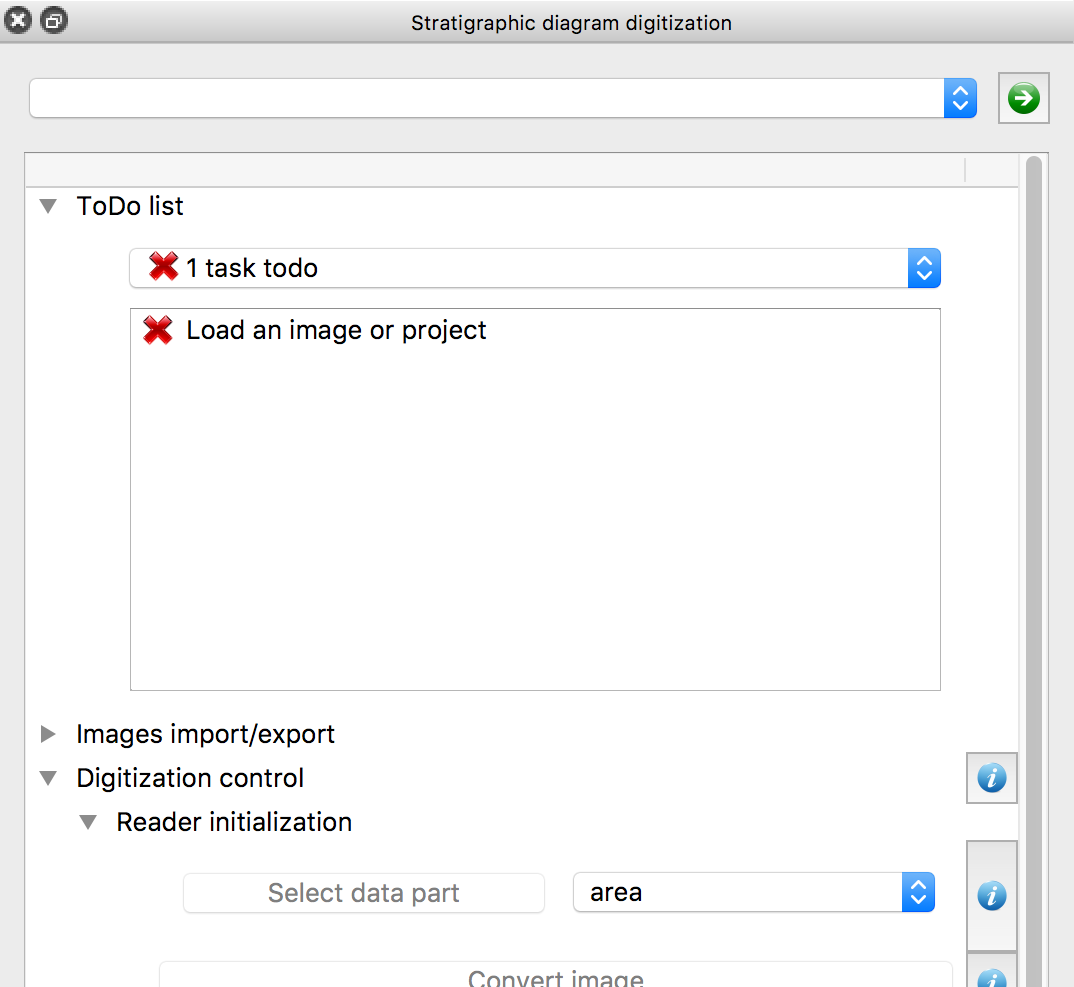
The interface to these semi-automatic steps is the straditizer control

Click the image to enlarge it
You can expand the submenus using the  buttons in the control and you
can access the user manual using the
  buttons on the right side.
Before we start with the diagram, we will highlight some of the sections in the GUI:
- The ToDo list
The list at the top of the control guides you through the straditization process. It shows the open tasks you should consider.
Most of them will be marked as done automatically, but if you think you are done with one of the tasks, just right-click the task and mark it as done.
- The Plot control
This section at the bottom of the control gives you some visual explorations of your diagram and the digitization process. You should, whenever possible, use it’s functionalities, most of the errors can be spotted visually
- The Help explorer
This separate widgets can be used to access the user manual and provides guidance for the different functionalities. This should always be your first point of reference if you have any problems.