10. Translating the y-axis
To correctly reproduce the diagram data, there are now only to more things to know, that is the scaling of the y- and x-axes in the diagram.
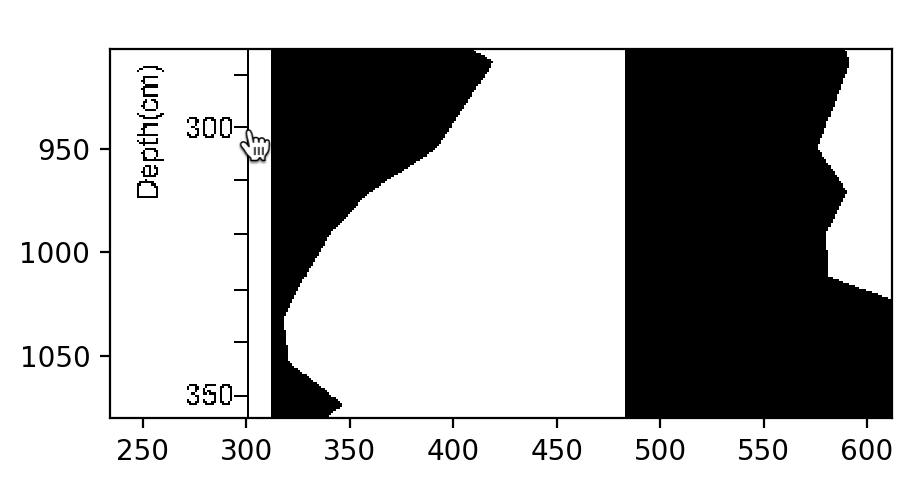
Expand the Axes translations tab in the digitization control
Click the Insert Y-axis values button in the Axes translations section of the straditizer control
Shift-leftclick on the plot to enter the corresponding y-value.
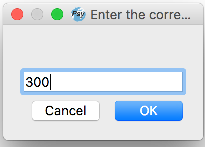
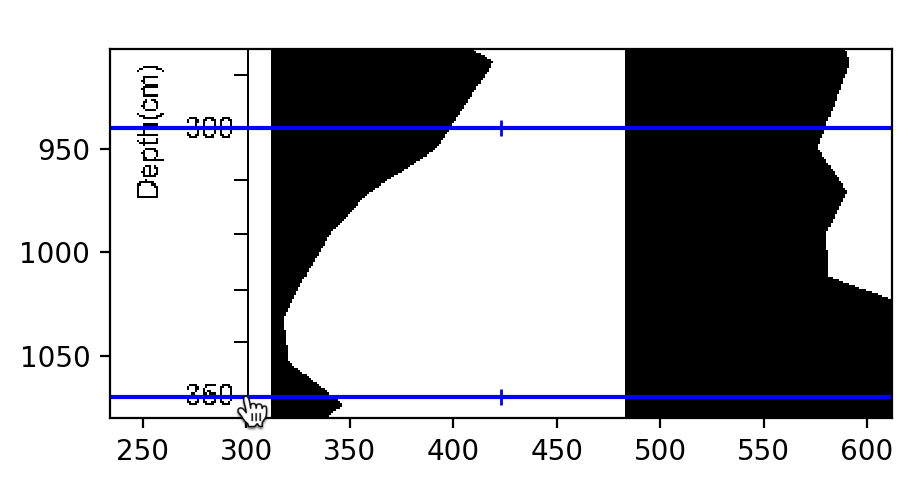
A small dialog will appear where you should enter the y-value to use (in this case,
300)
After hitting the Ok button, you will see a mark on the plot (blue line). You can select the mark via leftclick and drag it to a different location or you can delete it via rightclick.
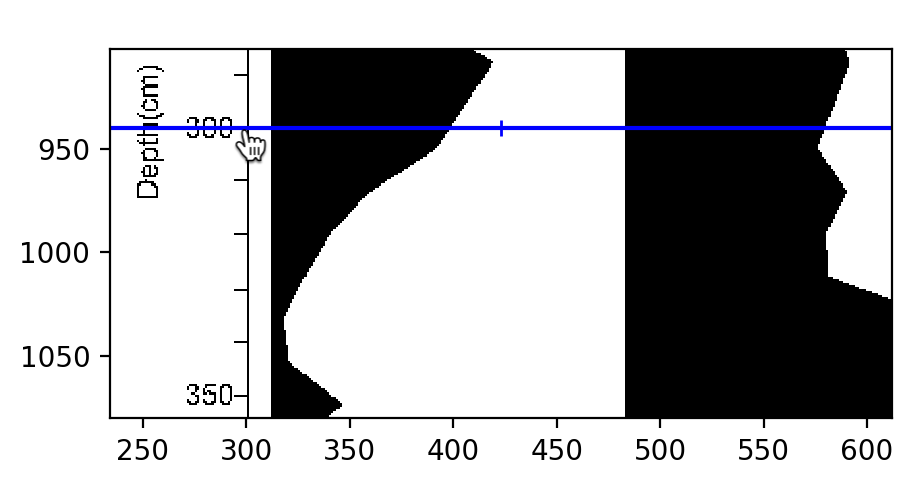
now repeat steps 2-4 on a second point on the y-axis
Select another point

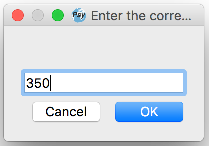
Enter the corresponding value (here
350)
A new mark is created that you can modify
Click the Apply button at the bottom of the straditizer control when you are done.
Note
If you drag a mark and hold the Shift button while releasing the mouse button, the dialog in point 3 from above will not pop up.