4. Select the diagram part
The second step involves selecting the diagram part. This is the part where your data is displayed, but without the vertical and horizontal axes descriptions.
Being exact in this step significantly reduces the later work and simplifies the automatic digitization.
Click the Select data part button in the digitization control.
Straditize automatically recognizes the data part. But you can change this by moving the crosses around with your mouse (see the note below).
Click the Apply button at the bottom
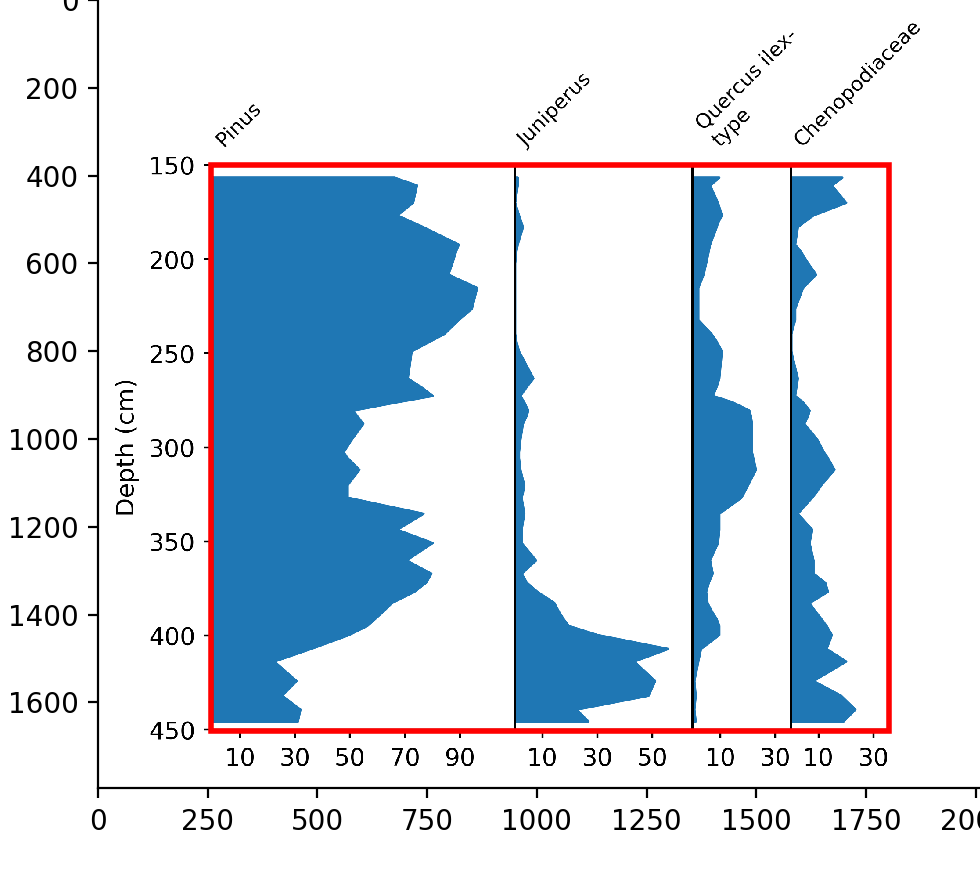
Done! You now see a red rectangle in your diagram the marks the data part. You can hide it using the Plot control section in the straditizer control. For the sake of this tutorial, expand the Plot control section and remove the rectangle by clicking the
 icon for the Diagram part
Note
These marks are very common in straditize. In general, you can left-click on a mark to move it around, right-click to delete it, and Shift+left-click on the plot to create a new one.
Note that you need to disable the
and
tools in the navigation to interact with the marks, by clicking on the corresponding button!
If you want to change the appearance of the marks, see the Marker control section in the straditizer control panel.