10. Translating the x-axes
Additionally to the vertical axis, we have to tell straditize how to interprete the x-axes of the stratigraphic diagram.
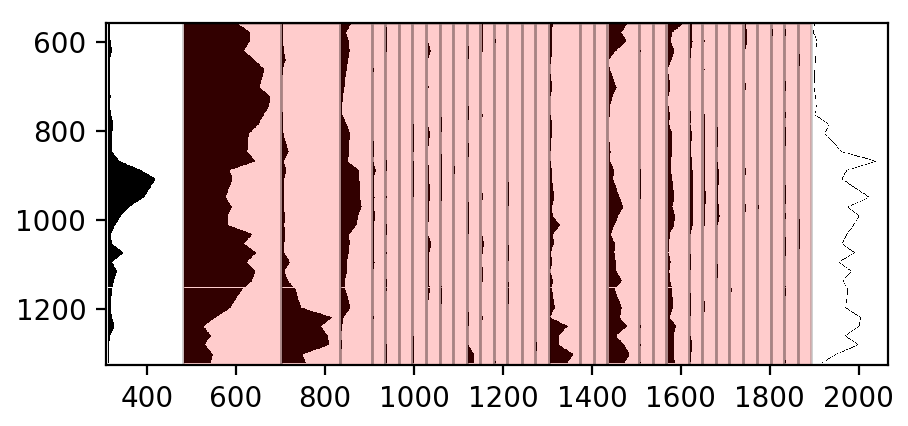
Here we have to deal different units of the x-axes in the diagrams. The first (Charcoal) and last (Pollen Concentration) columns are counts, the pollen taxa in between are in percent.
Therefore we will create column specific readers, one for the first and one for the last column. Then we will insert the x-axis data.
The steps down below are repetitive, but we will describe them for each step in detail.
The Charcoal column
Expand the Current reader tab in the digitization control
Click the + button to start the selection for a new reader
Click in the plot on the first column. It will turn red
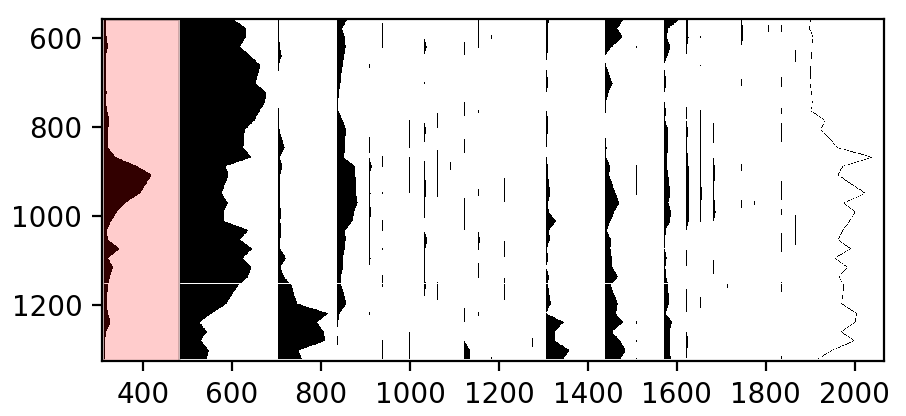
Click the Apply button and select the area reader in the appearing dialog
In the dropdown menu in the Current reader tab, select the reader for Column 0 to make it the current reader.
Now, we select the values for interpreting the x-axis of this column. The procedure is more or less the same, as before with the y-axis:
Click the Insert X-axis values button in the Axes translations section of the straditizer control
A small dialog will appear where you should enter the x-value of the start of the column (here
0).Note
The dialog only appears, if the start of one of the selected columns is visible. If this is not the case, Shift-Leftclick on the plot to create a mark.
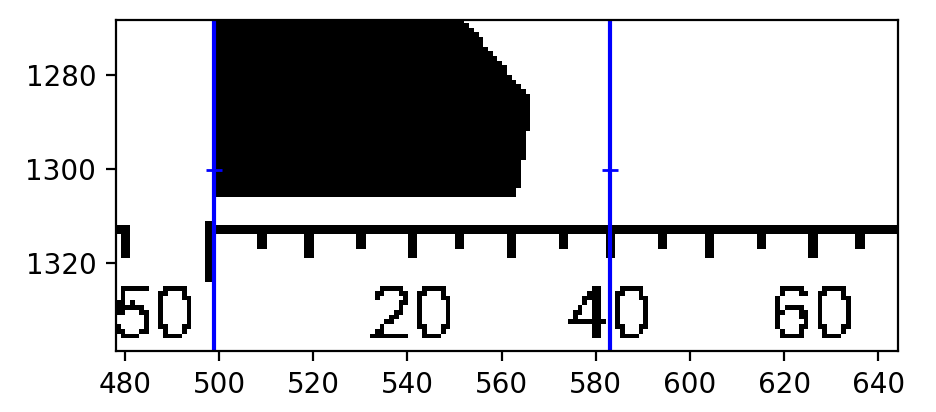
After hitting the Ok button, you will see a mark on the plot (blue line). You can select the mark via leftclick and drag it to a different location or you can delete it via rightclick.
now repeat steps 2-4 on a second point in the same column. Your diagram should now look something like this:
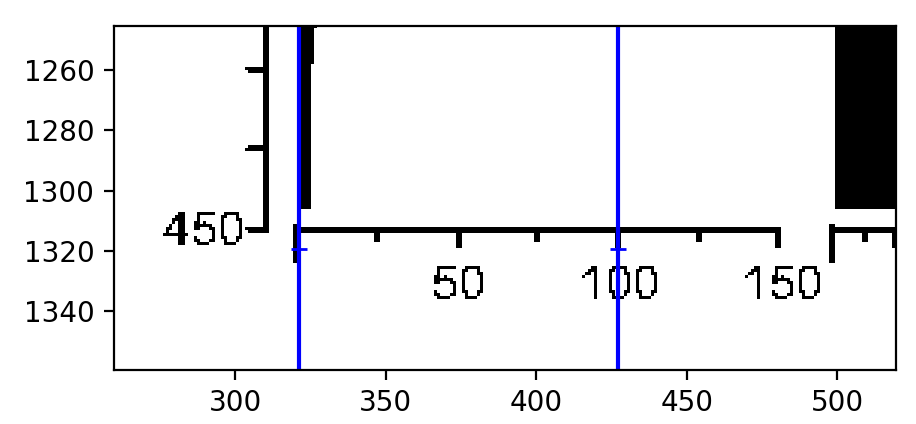
Click the Apply button at the bottom of the straditizer control and we can continue with the last column
The Pollen Concentration column
In the Current reader dropdown menu, select the reader for the columns 1-27
Click the + button to start the selection for a new reader
Click in the plot on the last column. It will turn red
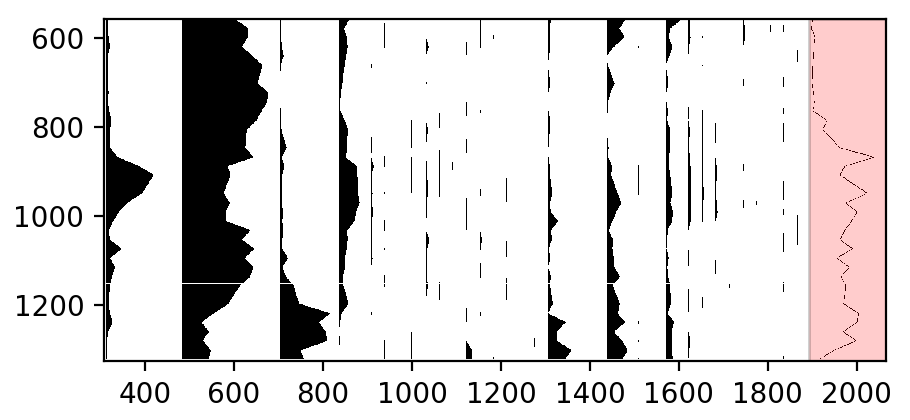
Click the Apply button and select the line reader in the appearing dialog.
In the dropdown menu in the Current reader tab, select the reader for Column 27 to make it the current reader.
Now, we select the values for interpreting the x-axis of this column. The procedure is the same as above:
Click the Insert X-axis values button in the Axes translations section of the straditizer control
In the appearing dialog, enter the x-value of the column start (here again
0) or Shift-Leftclick on the plot and then enter it (see note above).After hitting the Ok button, you will see a mark on the plot (blue line). Again, you can select the mark, drag it or delete it as before.
now repeat steps 2-4 on a second point in the same column. Your diagram should now look something like this:
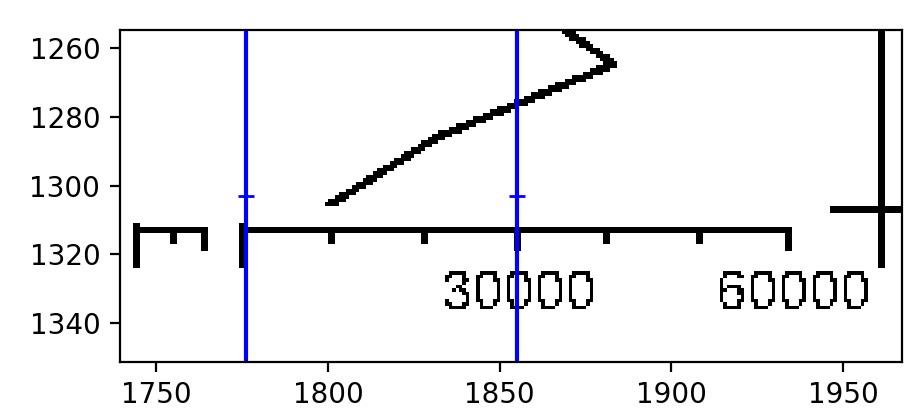
Click the Apply button at the bottom of the straditizer control and we can continue with the pollen taxa.
The pollen taxa columns
Last but not least, we translate the x-axes informations for the pollen taxa.
Luckily, as it is common for pollen diagrams, they all have the same scaling. Therefore it is enough to perform the above steps just for one of the columns.
In the dropdown menu in the Current reader tab, select the reader for Columns 1-26 to make it the current reader.
Click the Insert X-axis values button in the Axes translations section of the straditizer control
In the appearing dialog, enter the x-value of the column start (here again
0) or Shift-Leftclick on the plot and then enter it (see note above).After hitting the Ok button, you will see a mark on the plot (blue line). Again, you can select the mark, drag it or delete it as before.
now repeat steps 2-4 on a second point in the same column. Your diagram should now look something like this:
Click the Apply button at the bottom of the straditizer control.