Visualize your progress with the plot control
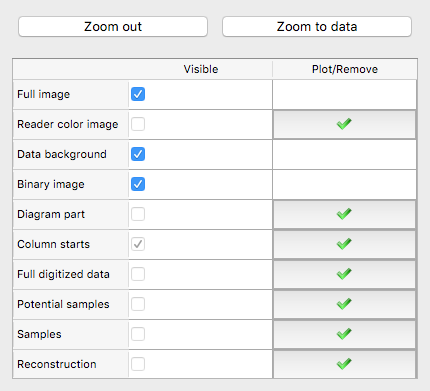
To explore and validate your digitization, straditize implements multiple ways to visualize the results. You can show and remove these static visualizations using the items in the plot control.
Here you can hide the several plot objects using the Visible
checkbox or you can plot the objects by clicking the  button or remove
it by clicking the
button or remove
it by clicking the  button.
Note
Please note, that these are static plots. So if you change your data, e.g.
through modifying the column starts, you have to remove () and
plot () the Column starts item to visualize the changes.
Some of the plotting features only visualize the currently selected columns. So if you have column-specific readers or exaggerations, these options hide and show the plots for the currently selected columns only.
- Full image:
The full image is the diagram, that you are digitizing
- Reader color image:
This is the diagram part of the currently selected columns in color.
- Data background:
This is just a white layer that lies over the Full image in the diagram part. If you want to see the diagram part in the Full image, you have to hide this layer
- Binary image:
This is the image that is used to digitize the diagram part. As with the Reader color image, this option shows/hides the binary image for the currently selected columns.
- Diagram part:
This draws a red rectangle around the diagram part (see the Basics and Terminology)
- Column starts:
Red lines showing you, where each column starts of out of the currently selected columns starts
- Full digitized data:
After having hit the Digitize button, you can visualize the full digitized data for the currently selected columns.
- Potential samples:
For each column, we identify rough locations where samples may lie (see Automatic samples identification). This plot option lets you visualize these.
- Samples:
This option draws horizontal lines to show, the sample locations
- Reconstruction:
This plot option draws one line for each column, as the Full digitized data does, but it uses only the x- and y-values at the sample locations.