Configuring the appearance of markers
In the digitization, you will work with markers to select parts of your image. These can be the marks to select the diagram part, to separate the columns or to edit your samples.
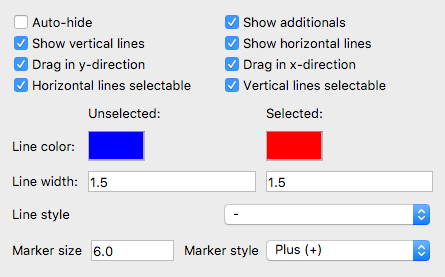
You can modify the appearance of the marks using the Marker control section in the straditization control. This helps you to better visualize and select different parts in the diagram.
The functionalities are
- Auto-hide
Hide the lines of the marks, when they are not selected
- Show additionals
When editing the samples, for example, you will also see the rough locations of the samples for each column (little grey crosses). With the Show additionals setting, you can hide or show them
- Show vertical lines and Show horizontal lines
If your marks are crosses, e.g. when you are selecting the diagram part, you can hide and show the vertical or horizontal lines with these settings
- Drag in y-direction and Drag in x-direction
If unchecked, a mark cannot be moved along the corresponding axes. You can use this option, if you want to change the y-value of a mark without changing the x-value (or the other way around)
- Horizontal lines selectable and Vertical lines selectable
If you uncheck one of these, you can prevent selecting a mark from the horizontal or vertical position. By default, you can select and move/drag a mark, by clicking on either of the lines (horizontal or vertical). But, for example, when editing the samples, many marks may lie on the same vertical position. Therefore it can be hard to move the mark of interest if you’re selecting the vertical line of the mark.
- Line color
This changes the color of all marks.
- Line width
This changes the line width of the marks. Sometimes it is better, if the linewidth increases when you are selecting a line
- Line style
You can change the style of the lines, to a dotted line, dashed line, etc.
- Marker size and Marker style
The location of the marks, i.e. where vertical and horizontal lines intersect, e.g. on corner of the diagram when selecting the diagram part, has a marker associated with it. It shows you, where the corner of your diagram is, where the sample value is, etc.. To make this more visible, you can change the size and the appearance of the mark.