Editing samples
To edit samples, click the Edit samples button and a new figure will be created with one mark for each sample and a table is shown to you with the samples data. To edit the samples, you can edit the table or the marks in the plots
The sample table
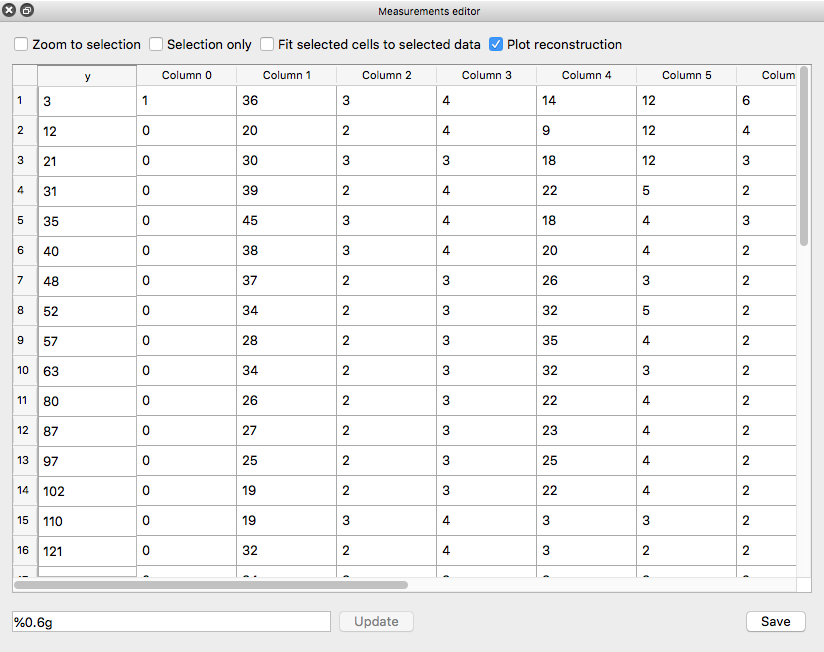
The sample table shows you the vertical coordinates of the samples and the values for each column obtained through the digitization.
Each row in this table represents one sample in the diagram.
The first column is the vertical location (y-axis) of the sample, the remaining columns are the x-values of the samples. The numbers shown in the table are in pixel coordinates of the diagram part. To interact with the samples, you can
Right click the table to add new or delete old samples/rows below or above the selected row
Edit the numbers in the cells to change the values for the samples.
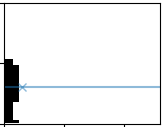
Fit the x-values of the samples to the data.
Either by right-click and Fit selected cells to the data, which will adjust the column values of the mark such, that it fits with the digitized value
original
fitted to data
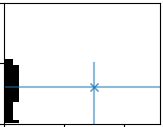
→
Or by using the Fit selected cells to selected data checkbox. If this is checked:
select cells in the table
click on the plot
the cells will be updated with the x-values from the digitization at the click-position
You can also zoom the selection or hide everything else but the selection.
Editing the marks
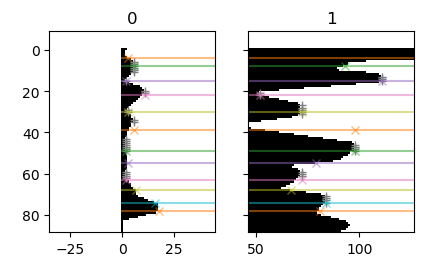
Additional to the table, you have a visual representation of the samples
in the figure. Here, you have one plot per column each mark represents the
vertical location of a sample. The marker x in the line shows you the
value of the sample (i.e. the location on the x-axes).
move a sample by
left-click a mark and hold the mouse button (the mark will change it’s color)
while still holing the mouse button, drag the mark to a different location
delete a sample by right-clicking the mark
add a new sample by holding down the Shift button and left-click on one of the plots.